.
.
 
 
. .
.
. . Turnout in Election to the European Parliament . .
. .
. . . . . . . . . . . . . . . .
Polska / Lublin ...
Lublin, okr. 8
Statistics on 07.06.2009
Population: 2184114
Area: 25121.5 km2
Population density: 86 os/km2
Summary voting results
No. of polling wards: 1807
No. of polling wards which
transmitted the results:
1807
No. of people entitled to vote: 1752645
No. of ballot papers issued: 386562
22.04%
lack13.60%15.57%17.54%19.51%21.48%23.45%25.42%27.39%29.36%31.33% 
of data15.56%17.53%19.50%21.47%23.44%25.41%27.38%29.35%31.32%33.30% 


. . Voting results . .
. .
. . . . . . . . . . . .
No. Name No. entitled
to vote
No. of ballot
papers issued
No. of No. of total votes / No. entitled to vote
[%]
total votes valid votes
060100bialski9019417374173591697019.25
066101Biała Podlaska, m.4611611794117881160825.56
060200biłgorajski8374317279172781691420.63
066201Chełm, m.5611512554125471236122.36
060300chełmski6443887698767850413.61
060400hrubieszowski5752891909188896815.97
060500janowski3866193109296916224.04
060600krasnostawski570801009210088983117.67
060700kraśnicki8068018254182301776222.60
060800lubartowski7250314470144481414419.93
060900lubelski11194321692216672125319.36
066301Lublin, m.27893592905928079185733.27
061000łęczyński4501776327631746816.95
061100łukowski8580315542155351513718.11
061200opolski5114884848472828216.56
061300parczewski3004064126404620721.32
061400puławski9617122320222932192523.18
061500radzyński4964810309102921004720.73
061600rycki4799496909688943820.19
061700świdnicki5884512815128051263121.76
061800tomaszowski7284313067130661273517.94
061900włodawski3354363306314617318.82
062000zamojski8901116644166411621518.70
066401Zamość, m.5464613634136291338124.94
  Lublin, okr. 8 1752645 386562 386233 378973 22.04
 
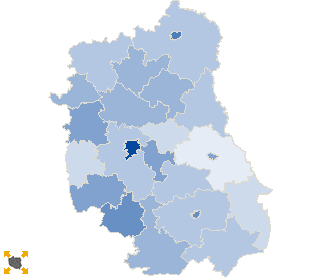
. . Turnout by location of ward electoral commission . .
. .
. . . . . . . . . . . .
No. Name No. entitled
to vote
No. of ballot
papers issued
No. of No. of total votes / No. entitled to vote
[%]
total votes valid votes
1City82468422528722506022180127.29
2Country92796116127516117315717217.37
. Turnout by number of inhabitants of commune .
1to 5 00022211338654386123759917.38
2from 5 001 to 10 00052605892722926749029317.62
3from 10 001 to 20 00032797964114640546271519.53
4from 20 001 to 50 00019930348353483014747324.23
5from 50 001 to 100 00019825749814497854903625.11
6from 100 001 to 200 00000000.00 
7from 200 001 to 500 00027893592905928079185733.27
8over 500 00000000.00 

 Statistical Data Legal Acts Electoral Bodies Election Committees and Candidates Turnout Results Search Documents Created by 
 top