|
|
| . |
. |
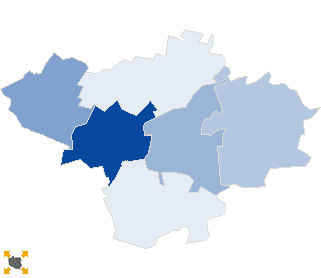
Voting results |
. |
. |
| . |
. |
| . |
. |
. |
. |
. |
. |
. |
. |
. |
. |
. |
. |
| No. |
Name |
No. entitled
to vote |
No. of ballot
papers issued |
No. of |
No. of total votes / No. entitled to vote
[%] |
| total votes |
valid votes |
| 061001 | Cyców, gm. | 5925 | 886 | 886 | 859 | 14.95 |  |
| 061002 | Ludwin, gm. | 3880 | 531 | 531 | 515 | 13.69 | |
| 061003 | Łęczna, gm. | 19663 | 3931 | 3930 | 3860 | 19.99 | |
| 061004 | Milejów, gm. | 7362 | 983 | 983 | 950 | 13.35 | |
| 061005 | Puchaczów, gm. | 4052 | 623 | 623 | 616 | 15.38 | |
| 061006 | Spiczyn, gm. | 4135 | 678 | 678 | 668 | 16.40 | |
| |
łęczyński |
45017 |
7632 |
7631 |
7468 |
16.95 |
 |
|
| |
| . |
. |
Turnout by location of ward electoral commission |
. |
. |
| . |
. |
| . |
. |
. |
. |
. |
. |
. |
. |
. |
. |
. |
. |
| No. |
Name |
No. entitled
to vote |
No. of ballot
papers issued |
No. of |
No. of total votes / No. entitled to vote
[%] |
| total votes |
valid votes |
| 1 | City | 16756 | 3479 | 3478 | 3413 | 20.76 | |
| 2 | Country | 28261 | 4153 | 4153 | 4055 | 14.70 | |
| . |
Turnout by number of inhabitants of commune |
. |
| 1 | to 5 000 | 0 | 0 | 0 | 0 | 0.00 | |
| 2 | from 5 001 to 10 000 | 25354 | 3701 | 3701 | 3608 | 14.60 | |
| 3 | from 10 001 to 20 000 | 0 | 0 | 0 | 0 | 0.00 | |
| 4 | from 20 001 to 50 000 | 19663 | 3931 | 3930 | 3860 | 19.99 | |
| 5 | from 50 001 to 100 000 | 0 | 0 | 0 | 0 | 0.00 | |
| 6 | from 100 001 to 200 000 | 0 | 0 | 0 | 0 | 0.00 | |
| 7 | from 200 001 to 500 000 | 0 | 0 | 0 | 0 | 0.00 | |
| 8 | over 500 000 | 0 | 0 | 0 | 0 | 0.00 | |
|
|


 Statistical DataLegal ActsElectoral BodiesElection Committees and CandidatesTurnoutResultsSearchDocumentsCreated by