|
|
|
|
| |
| . |
. |
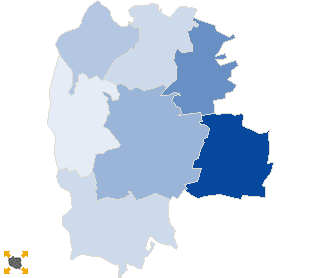
Turnout by location of ward electoral commission |
. |
. |
| . |
. |
| . |
. |
. |
. |
. |
. |
. |
. |
. |
. |
. |
. |
| No. |
Name |
No. entitled
to vote |
No. of ballot
papers issued |
No. of |
No. of total votes / No. entitled to vote
[%] |
| total votes |
valid votes |
| 1 | City | 12240 | 2483 | 2475 | 2438 | 20.22 |  |
| 2 | Country | 38908 | 6001 | 5997 | 5844 | 15.41 | |
| . |
Turnout by number of inhabitants of commune |
. |
| 1 | to 5 000 | 3965 | 615 | 615 | 593 | 15.51 | |
| 2 | from 5 001 to 10 000 | 20140 | 3237 | 3235 | 3146 | 16.06 | |
| 3 | from 10 001 to 20 000 | 27043 | 4632 | 4622 | 4543 | 17.09 | |
| 4 | from 20 001 to 50 000 | 0 | 0 | 0 | 0 | 0.00 | |
| 5 | from 50 001 to 100 000 | 0 | 0 | 0 | 0 | 0.00 | |
| 6 | from 100 001 to 200 000 | 0 | 0 | 0 | 0 | 0.00 | |
| 7 | from 200 001 to 500 000 | 0 | 0 | 0 | 0 | 0.00 | |
| 8 | over 500 000 | 0 | 0 | 0 | 0 | 0.00 | |
|
|


 Statistical DataLegal ActsElectoral BodiesElection Committees and CandidatesTurnoutResultsSearchDocumentsCreated by