|
|
| . |
. |
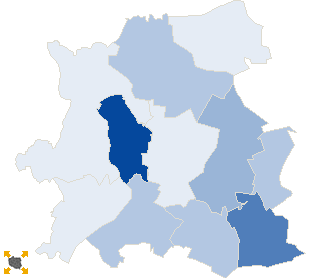
Voting results |
. |
. |
| . |
. |
| . |
. |
. |
. |
. |
. |
. |
. |
. |
. |
. |
. |
| No. |
Name |
No. entitled
to vote |
No. of ballot
papers issued |
No. of |
No. of total votes / No. entitled to vote
[%] |
| total votes |
valid votes |
| 061402 | Baranów, gm. | 3427 | 601 | 585 | 582 | 17.07 |  |
| 061403 | Janowiec, gm. | 2992 | 520 | 520 | 507 | 17.38 | |
| 061404 | Kazimierz Dolny, gm. | 5823 | 1102 | 1102 | 1086 | 18.92 | |
| 061405 | Końskowola, gm. | 7343 | 1270 | 1270 | 1246 | 17.30 | |
| 061406 | Kurów, gm. | 6390 | 1285 | 1285 | 1269 | 20.11 | |
| 061407 | Markuszów, gm. | 2458 | 474 | 474 | 455 | 19.28 | |
| 061408 | Nałęczów, gm. | 8010 | 1966 | 1966 | 1925 | 24.54 | |
| 061409 | Puławy, gm. | 9183 | 1504 | 1504 | 1466 | 16.38 | |
| 061401 | Puławy, m. | 41380 | 11832 | 11821 | 11686 | 28.57 | |
| 061410 | Wąwolnica, gm. | 3862 | 743 | 743 | 722 | 19.24 | |
| 061411 | Żyrzyn, gm. | 5303 | 1023 | 1023 | 981 | 19.29 | |
| |
puławski |
96171 |
22320 |
22293 |
21925 |
23.18 |
 |
|
| |
| . |
. |
Turnout by location of ward electoral commission |
. |
. |
| . |
. |
| . |
. |
. |
. |
. |
. |
. |
. |
. |
. |
. |
. |
| No. |
Name |
No. entitled
to vote |
No. of ballot
papers issued |
No. of |
No. of total votes / No. entitled to vote
[%] |
| total votes |
valid votes |
| 1 | City | 48944 | 13942 | 13931 | 13758 | 28.46 | |
| 2 | Country | 47227 | 8378 | 8362 | 8167 | 17.71 | |
| . |
Turnout by number of inhabitants of commune |
. |
| 1 | to 5 000 | 12739 | 2338 | 2322 | 2266 | 18.23 | |
| 2 | from 5 001 to 10 000 | 32869 | 6646 | 6646 | 6507 | 20.22 | |
| 3 | from 10 001 to 20 000 | 9183 | 1504 | 1504 | 1466 | 16.38 | |
| 4 | from 20 001 to 50 000 | 0 | 0 | 0 | 0 | 0.00 | |
| 5 | from 50 001 to 100 000 | 41380 | 11832 | 11821 | 11686 | 28.57 | |
| 6 | from 100 001 to 200 000 | 0 | 0 | 0 | 0 | 0.00 | |
| 7 | from 200 001 to 500 000 | 0 | 0 | 0 | 0 | 0.00 | |
| 8 | over 500 000 | 0 | 0 | 0 | 0 | 0.00 | |
|
|


 Statistical DataLegal ActsElectoral BodiesElection Committees and CandidatesTurnoutResultsSearchDocumentsCreated by