|
|
| . |
. |
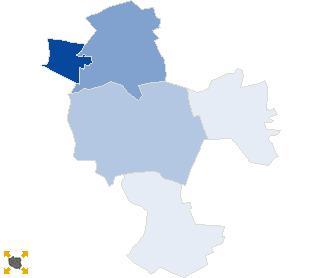
Voting results |
. |
. |
| . |
. |
| . |
. |
. |
. |
. |
. |
. |
. |
. |
. |
. |
. |
| No. |
Name |
No. entitled
to vote |
No. of ballot
papers issued |
No. of |
No. of total votes / No. entitled to vote
[%] |
| total votes |
valid votes |
| 061702 | Mełgiew, gm. | 6670 | 1198 | 1198 | 1172 | 17.96 |  |
| 061703 | Piaski, gm. | 8624 | 1368 | 1368 | 1337 | 15.86 | |
| 061704 | Rybczewice, gm. | 3191 | 378 | 378 | 371 | 11.85 | |
| 061701 | Świdnik, m. | 33042 | 9018 | 9008 | 8915 | 27.26 | |
| 061705 | Trawniki, gm. | 7318 | 853 | 853 | 836 | 11.66 | |
| |
świdnicki |
58845 |
12815 |
12805 |
12631 |
21.76 |
 |
|
| |
| . |
. |
Turnout by location of ward electoral commission |
. |
. |
| . |
. |
| . |
. |
. |
. |
. |
. |
. |
. |
. |
. |
. |
. |
| No. |
Name |
No. entitled
to vote |
No. of ballot
papers issued |
No. of |
No. of total votes / No. entitled to vote
[%] |
| total votes |
valid votes |
| 1 | City | 35201 | 9456 | 9446 | 9337 | 26.83 | |
| 2 | Country | 23644 | 3359 | 3359 | 3294 | 14.21 | |
| . |
Turnout by number of inhabitants of commune |
. |
| 1 | to 5 000 | 3191 | 378 | 378 | 371 | 11.85 | |
| 2 | from 5 001 to 10 000 | 13988 | 2051 | 2051 | 2008 | 14.66 | |
| 3 | from 10 001 to 20 000 | 8624 | 1368 | 1368 | 1337 | 15.86 | |
| 4 | from 20 001 to 50 000 | 33042 | 9018 | 9008 | 8915 | 27.26 | |
| 5 | from 50 001 to 100 000 | 0 | 0 | 0 | 0 | 0.00 | |
| 6 | from 100 001 to 200 000 | 0 | 0 | 0 | 0 | 0.00 | |
| 7 | from 200 001 to 500 000 | 0 | 0 | 0 | 0 | 0.00 | |
| 8 | over 500 000 | 0 | 0 | 0 | 0 | 0.00 | |
|
|


 Statistical DataLegal ActsElectoral BodiesElection Committees and CandidatesTurnoutResultsSearchDocumentsCreated by